Translate this page into:
Thyroid volume and its correlation with thyroid function in Central India
* Corresponding author: Priya Solanki, Department of Radiodiagnosis, MGMMC & MYH Indore, Madhya Pradesh, India. priyasolanki1245@gmail.com
-
Received: ,
Accepted: ,
How to cite this article: Agrawal A, Bhandari G, Sahoo A, Solanki P. Thyroid volume and its correlation with thyroid function in central India. Future Health. 2024;2:2–6. doi: 10.25259/FH_18_2024
Abstract
Objectives
Due to its strong correlation with age, gender, anthropometric parameters, and geographic location, thyroid gland volume varies widely. Finding the reference range of a healthy individual’s normal thyroid gland volume has become crucial for every community. Thus, the public will be better able to grade goiter, and large-scale iodine monitoring initiatives will be guided by this. Ultrasound (US) eliminates the issues of overestimation of goiter prevalence and significant interobserver variability associated with palpation estimates, as it is more accurate than clinical examination in diagnosing enlarged thyroid glands.
This research aimed to use ultrasonography to determine reference ranges for total thyroid volume in the normal adult population in central India and to connect the results with thyroid function tests.
Material and Methods
A tertiary-care hospital hosted a prospective cross-sectional study. There were 410 healthy subjects in total. B-Grey scale imaging US was utilized to assess the overall thyroid volume by adding the volume of both lobes, which was calculated using the ellipsoid formula. In order to examine thyroid function, blood samples were obtained. Age-appropriate thyroid volume reference values were found.
Results
The average thyroid gland volume across all research participants was 6.90 ± 1.74 ml. The gland volume of males was considerably greater (7.30 ± 1.86 ml) than that of females (6.63 ± 1.61 ml) (P<0.001). In both genders, the right lobe’s volume was considerably higher than the left lobe’s (3.76 ± 0.96 ml vs. 3.14 ± 0.89 ml, P < 0.001). There was no discernible relationship between thyroid function tests and gland volume.
Conclusion
We made an effort to help set the reference values for our community, but more extensive research is needed to set the thyroid gland volume reference values for the entire country.
Keywords
Thyroid volume
Ultrasonography
Thyroid Function Test
Adult

INTRODUCTION
The thyroid is situated superficially in the infrahyoid region of the neck. It is located in an area defined by the trachea, esophagus, carotid arteries, jugular veins, and muscles between the C5 and T1 vertebral levels. Thyroxine (T4) and triiodothyronine (T3), two thyroid hormones necessary for many physiological processes, including body metabolism regulation and human growth and development, are produced, stored, and released by the thyroid gland. The thyroid gland’s size and form vary greatly depending on factors such as location, race, and individual phenotype, in addition to the body’s physiological state.1 Furthermore, in healthy individuals, thyroid volume can also be impacted by specific socioeconomic factors, including smoking2 drinking alcohol, consuming excess goitrogens, and eating iodine in their diet. Estimating the thyroid volume is crucial in a number of medical situations3 such as thyroiditis, iodine deficiency, goiter, and others.
An enlarged thyroid with an elevated thyroid volume (TV) is labeled goiter. It functions as a useful biomarker for determining a person’s or a population’s iodine status. Diagnosing goiter involves a clinical examination. Unfortunately, because of its subjective character and the anatomical variations in the neck, it has poor sensitivity and specificity. When compared with physical examination, the estimation of thyroid volume by ultrasound (US) scans is more objective, accurate, and repeatable. According to ultrasonography, a goiter is characterized by glands larger than the 97th percentile value of the normal population. Because of this, ultrasonography is typically used in epidemiological research to evaluate the prevalence of goiter and the status of iodine in the population. As a result, sonography is now recognized as the diagnostic technique for evaluating goiter by the World Health Organization (WHO) and the International Council for the Control of Iodine Deficiency Disorders (ICCIDD). US is a quick, affordable, accessible, safe, and comfortable noninvasive procedure. Thyroid size can be determined by ultrasonography, which can also identify nonpalpable nodules, gauge their size, and describe their characteristics. To the best of our knowledge, there is currently little information available on the average thyroid gland volume in Indian adults.
MATERIAL AND METHODS
Study Population and Design: This study was a cross-sectional, time-limited, hospital-based investigation carried out in a tertiary healthcare facility in central India. The research was carried out between February 2021 and July 2022. The study comprised 410 individuals in total who were sent to the Department of Radiodiagnosis for an US screening recommended for any pathology other than thyroid problem. A thyroid function test was not done prior to the recruitment of the patients in the study. US examination in our study was done free of cost.
Inclusion Criteria: Patients between 18 and 60 years of age who have been referred to the Department of Radiodiagnosis for an US assessment indicated for any nonthyroid pathology.
Exclusion Criteria
-
1.
Females during menstruation, pregnancy, or those who have delivered within the last 12 months,
-
2.
Subjects with clinical evidence of thyroid/endocrine disorder,
-
3.
Individuals who have a documented history of thyroid conditions or who have a family history of thyroid conditions,
-
4.
Subjects taking antithyroid drugs or any drugs that alter thyroid hormone metabolism,
-
5.
Individuals exhibiting any anomalies in the gland during the thyroid ultrasonography examination or individuals with abnormal thyroid function tests.
Technique: Informed consent and relevant clinical history were obtained as per the predecided questionnaire. US examination was performed by a person having at least one-year experience in sonography. To facilitate head extension, a pillow was positioned under the shoulders of the supine patients during the examination. A high-resolution linear transducer (7–12 MHz) was used for all examinations. Both longitudinal and transverse planes contained images of the isthmus and each lobe. Measurements in centimeters (cm) were made for depth (AP), width (transverse), and length (longitudinal) [Figures 1a and 1b]. We collected and examined the thyroid volume data for the right and left lobes independently. The total volume did not include the isthmus.
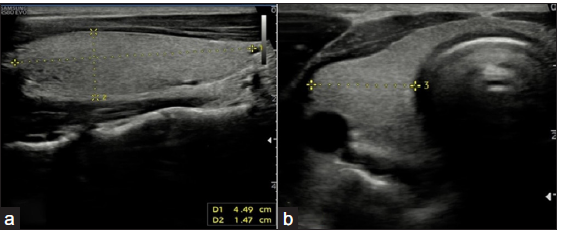
- (a) B-mode ultrasound image of the thyroid gland in longitudinal and (b) transverse views showing the correct method of measurements for depth Anteroposterior (AP), width (transverse), and length (longitudinal) dimensions in centimeters (cm).
Because of its cone-shaped morphology, each lobe is meant to resemble an ellipsoid. Its volume is determined by multiplying the length (L), width (W), and depth (d) in centimeters by a correction factor of 0.479 for each lobe in the Brunn et al.4 equation using the ellipsoid model formula. Thyroid volume was calculated using the Brunn expression:VUS = 0.479 ´ L ´ W ´ d.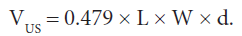
The combined volume of the two lobes made up the overall thyroid volume: VThyroid = VRight lobe + VLeft lobe.
The thyroid hormone profiles (T3, T4, and TSH) of the subjects were then requested, which was done free of cost, and the findings were subsequently acquired and documented. If the thyroid function test result came back abnormal, then the participant was excluded from the study.
RESULTS
A total of 410 adults were recruited, comprising 172 (41.9%) males and 238 (58.1%) females. The subjects’ average age was 35.22 ± 11.76 years, with 42.4 percent of them falling between the 18 and 30 age range [Figure 2]. Males had an average age of 35.59 ± 12.17 years (range: 18–60), whereas females had an average age of 34.96 ± 11.46 years (range: 18–60). The age group of 51–60 years old had the fewest people (12.4%).
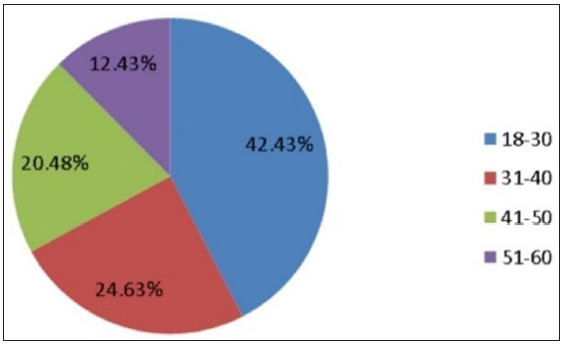
- Pie chart showing distribution of patients according to age.
In our investigation, the average thyroid volume was 6.90 ± 1.74 ml overall [Table 1]. It was discovered that the thyroid’s highest volume was 15.66 ml, and its lowest volume was 2.44 ml. Just 4.14% of the patients had a thyroid volume of more than 10 ml, compared with the majority (81.95%) who had a thyroid volume between 5 and 10 ml.
| Mean Volume (in ml) | Median | Std. deviation | Variance | Minimum volume (in ml) | Maximum volume (in ml) | |
|---|---|---|---|---|---|---|
| Right lobe | 3.7623 | 3.7600 | 0.96999 | 0.941 | 1.31 | 8.24 |
| Left lobe | 3.1475 | 3.2050 | 0.89570 | 0.802 | 1.13 | 7.42 |
| Total volume | 6.9098 | 6.8900 | 1.74998 | 3.062 | 2.44 | 15.66 |
The age group of 31–40 had the highest mean total thyroid volume (7.45 ± 1.84 ml), whereas the 18–30 age group had the lowest mean total thyroid volume (6.58 ± 1.74 ml). In the age categories of 18–30, 31–40, 41–50, and 51–60, the mean total gland volume was 6.58 ml, 7.45 ml, 7.03 ml, and 6.71 ml, respectively. The total thyroid volume progressively rose till the age range of 31– 40 years and then it decreased. However, the difference in average thyroid volume among the age groups was not statistically significant.
The total mean thyroid volume for males was 7.30+1.86 ml [Table 2]. Among male participants, the highest mean total volume of 7.98 ml was seen in the 31–40 age group, whereas the lowest mean volume of 6.73 ml was seen in the 51–60 age group.
The total mean thyroid volume in females was 6.63 ± 1.61 ml (range 2.44-13.76 ml). Among the female participants, the highest mean total volume of 7.15 ± 1.67 ml was observed in the 41–50 age group, whereas the lowest mean volume of 6.03 ± 1.52 ml was noticed in the 18–30 age group [Table 3].
| Age group | Right lobe volume (Mean+/-SD) | Left lobe volume (Mean+/-SD) | Total thyroid Volume (Mean+/-SD) |
|---|---|---|---|
| 18-30 | 3.9434+/-0.94197 | 3.3923+/-0.91566 | 7.3357+/-1.75844 |
| 31-40 | 4.3453+/-1.18676 | 3.6392+/-1.14775 | 7.9845+/-2.22149 |
| 41-50 | 3.8003+/-0.86852 | 3.0629+/-0.93591 | 6.8632+/-1.66125 |
| 51-60 | 3.8162+/-0.86413 | 2.9177+/-0.77332 | 6.7338+/-1.55885 |
| Overall | 3.98+/-0.99 | 3.32+/-0.98 | 7.30+/-1.86 |
SD: Standard deviation
| Age Group | Right lobe volume (Mean+/-SD) | Left lobe volume (Mean+/-SD) | Total thyroid Volume (Mean+/-SD) |
|---|---|---|---|
| 18-30 | 3.2611+/-0.85128 | 2.7743+/-0.75373 | 6.0354+/-1.52722 |
| 31-40 | 3.8356+/-0.88874 | 3.3010+/-0.73726 | 7.1365+/-1.50575 |
| 41-50 | 3.9272+/-0.94745 | 3.2256+/-0.87302 | 7.1528+/-1.67520 |
| 51-60 | 3.7236+/-0.85033 | 2.9792+/-0.80041 | 6.7028+/-1.31489 |
| Overall | 3.60+/-0.92 | 3.03+/-0.81 | 6.63+/-1.61 |
The mean T3 level, T4 level, and Thyroid stimulating Hormone (TSH) level in our study were 1.09 ng/ml, 8.25 mcg/dl, and 2.63 uIU/ml, respectively. There was no significant variation in hormone levels with respect to age.
DISCUSSION
The average thyroid volume in our study was 6.90 ± 1.74 ml. This was concordant with the studies done in Southeast Asian and African nations. However, compared with the European, Mediterranean, and Chinese populations, the average thyroid volume was less in our study. We also found that the average thyroid volume was significantly higher in males (7.30 ± 1.86 ml) compared with females (6.63 ± 1.61 ml) (p < 0.001). This was in agreement with the studies conducted by Guo et al,5 Memon et al,1 and Gomez et al.6 Numerous justifications have been offered for the disparity in total gland volume (TGV) between the sexes. According to Nafisi et al,7 the variation in TGV could be attributed to the disparity in body weight between males and females. According to Salaam et al., this might be because men have a higher body mass index than women of the same age.8
The average right lobe volume (3.76 ± 0.96 ml) was significantly greater than that of the left lobe volume (3.14 ± 0.89 ml) in our study (p < 0.001). The left side of the thyroid gland is related to the esophagus, which is most likely the cause of the asymmetry between its two lobes. With increasing age, the overall gland volume first rose and subsequently fell. Nonetheless, there was no discernible change in total gland volume between the age groups. Hence, there was no statistically significant association between thyroid volume and age. This was in agreement with the studies of Nafisi et al,7 Salaam et al,8 Morna et al,9 and Turcios et al,10 which revealed no significant association (p > 0.05). However, this finding was contrary to the studies of Kamran et al,11 Seker et al,12 and Kayastha et al,13 all of which revealed a significant association between thyroid volume and age.
Likewise, the difference in total gland volume among both male and female age groups was not statistically significant (p > 0.05). Lamichhane et al.14 and Guo et al.5 also reported similar findings.
In our investigation, the mean T3 level, T4 level, and TSH level were 1.09 ng/ml, 8.25 mcg/dl, and 2.63 uIU/ml, respectively. Hormone levels did not significantly vary with age. For both sexes, the mean T3 level was nearly equal (1.07 ng/ml for men and 1.11 ng/ml for women). While both genders had nearly the same mean TSH level, the mean T4 level was somewhat higher in females (8.47 mcg/dl) compared with males (7.95 mcg/dl). When thyroid volume and thyroid hormone levels were compared using Spearman’s rank correlation coefficient and Pearson’s R coefficient, no significant link was discovered between the two variables, which was consistent with the findings of Adibi et al.15
Glands with a volume greater than the 97th percentile are classified as goiters by ultrasonography. The formula mean + 2.17 SD is used to determine the 97th percentile volume. In our investigation, 10.67 ml was determined to be the thyroid volume at the 97th percentile. Therefore, in our community, a sonographic diagnosis of goiter can be made for any individual whose total thyroid volume exceeds 10.67 ml. Similarly, for males and females, the volume cutoff to take goiter into account was 11.33 ml and 10.12 ml, respectively. These cutoff values resemble those given by Adibi et al. in Iran to some extent.15 In Isfahan, Iran, 200 people (mean age 37.27 years) were studied, and the results showed that on sonography, goiter should be considered if thyroid volumes are greater than 10.14 ml, 11.48 ml, and 8.37 ml in all males and females.15
CONCLUSION
A thyroid volume Normogram in our setting is crucial for treating patients with thyroid disorders, particularly goiter, as a point of reference. To our knowledge, this is the first thyroid volume reference obtained from ultrasonography in central India. It is advised that these numbers be used as reference values in this region. Based on these facts, we attempted to support the creation of national reference values. Given the correlation between anthropometric measurements, genetics, and environmental factors and thyroid volume, we suggest conducting additional nationwide research to establish national reference values for normal thyroid volume in India.
Ethical approval
Institutional Review Board approval is not required.
Declaration of patient consent
Patient’s consent is not required as patients’ identity is not disclosed or compromised.
Financial support and sponsorship
Nil.
Conflicts of interest
There are no conflicts of interest.
Use of artificial intelligence (AI)-assisted technology for manuscript preparation
The authors confirm that there was no use of artificial intelligence (AI)-assisted technology for assisting in the writing or editing of the manuscript and no images were manipulated using AI.
References
- Ultrasonographic estimation of Thyroid gland volume in healthy subjects of interior Sindh (Province of Pakistan) The Professional Medical Journal. 2020;27:185-90.
- [Google Scholar]
- Smoking as a risk factor for thyroid volume progression and incident goiter in a region with improved iodine supply. European journal of endocrinology. 2008;159:761-6.
- [CrossRef] [PubMed] [Google Scholar]
- A review of sonographic thyroid volume and iodine sufficiency in children: An Australian perspective. Australasian Journal of Ultrasound in Medicine. 2020;23:33-8.
- [CrossRef] [PubMed] [PubMed Central] [Google Scholar]
- Volumetrie der Schilddrüsenlappen mittels real-time-Sonographie. Dtsch Med Wochensch. 1981;106:1338-40.
- [Google Scholar]
- New reference values for thyroid volume and a comprehensive assessment for influencing factors in Chinese adults with iodine sufficiency. European thyroid journal. 2021;10:447-54.
- [CrossRef] [PubMed] [PubMed Central] [Google Scholar]
- Determinants of thyroid volume as measured by ultrasonography in healthy adults randomly selected. Clinical endocrinology. 2000;53:629-34.
- [CrossRef] [PubMed] [Google Scholar]
- Influence of physiological factors on thyroid size determined by ultrasound. Acta Medica Iranica 2011:302-4.
- [PubMed] [Google Scholar]
- Determination of normal thyroid gland volume on ultrasound in normal adults in jos, North Central Nigeria. International Journal of Scientific and Research Publications. 2020;10:44-54.
- [Google Scholar]
- AA community-based ultrasound determination of normal thyroid volumes in the adult population, Assin North District, Ghana. Pan Afr Med J. 2020;37:251.
- [CrossRef] [PubMed] [PubMed Central] [Google Scholar]
- Thyroid volume and its relation to anthropometric measures in a healthy cuban population. European thyroid journal. 2015;4:55-61.
- [CrossRef] [PubMed] [PubMed Central] [Google Scholar]
- Thyroid nodule size and prediction of cancer. The Journal of Clinical Endocrinology & Metabolism. 2013;98:564-70.
- [PubMed] [Google Scholar]
- Determination of thyroid volume and its relation with isthmus thickness. European journal of general medicine. 2010;7:125-9.
- [Google Scholar]
- Study of thyroid volume by ultrasonography in clinically euthyroid patients. Journal of Institute of Medicine Nepal (JIOMN). 2010;32
- [Google Scholar]
- Age-and gender-specific changes in thyroid size and thyroid function test values of euthyroid subjects. Journal of Biosciences and Medicines. 2018;6:59-73.
- [Google Scholar]
- Normal values of thyroid gland in Isfahan, an iodine replete area. J Res Med Sci. 2008;13:55-60.
- [Google Scholar]