Translate this page into:
Role of renal elastography in the evaluation of chronic kidney disease and correlation with renal resistive index, serum creatinine, and estimated glomerular filtration rate

Corresponding author: Dr. Jitendra Sharma, Department of Radiodiagnosis, All India Institute of Medical Sciences, Bhopal, India. jeet.imsbhu@gmail.com
-
Received: ,
Accepted: ,
How to cite this article: Rehman NUr, Malik R, Sharma J. Role of renal elastography in the evaluation of chronic kidney disease and correlation with renal resistive index, serum creatinine and estimated glomerular filtration rate. Future Health. 2024;2:15–20. doi:10.25259/FH_11_2024.
Abstract
Objectives
Chronic kidney disease (CKD) is a progressive condition affecting >10% of the population worldwide. The diagnosis and staging are based on the clinical and biochemical assays. Shear wave elastography (SWE) is an emerging ultrasound technique that has a potential role in assessing the severity of CKD; however, it is still in the preliminary phase and has not been incorporated into guidelines. Hence, this study aimed to evaluate the role of SWE in assessing the severity of CKD and whether there is any correlation between shear wave velocity (SWV) values with serum creatinine, estimated glomerular filtration rate (eGFR) and renal resistive index (RI).
Material and Methods
A cross-sectional observational study included 106 patients in two groups: one group of proven cases of CKD (total of 52) and another group of non-CKD healthy controls (total of 54). Both groups underwent renal elastography and color Doppler to measure SWV and renal RI. Results were compared between the groups, as well as serum creatinine and eGFR.
Results
Mean SWV decreased with increased serum creatinine values, decreased eGFR, and advancement of CKD grades. SWV showed an inverse linear correlation with renal RI. A cutoff SWV value of 2.49 m/s was able to discriminate at least grade 3 and above CKD kidneys from the early grade CKD (grades 1 & 2) and the controls.
Conclusion
Renal elastography, along with renal Doppler, can be a potential adjunct method in assessing CKD patients, especially in the case of diabetic nephropathy, where conventional sonography findings can be equivocal.
Keywords
Shear wave elastography
shear wave velocity
tissue elastography
tissue stiffness
kidney disease
color Doppler ultrasonography

INTRODUCTION
Chronic kidney disease (CKD) is a progressive deterioration of renal function. Its principal causes include increased blood pressure, diabetes, and primary renal disorders such as nephrotic syndrome, glomerulonephritis, etc. CKD poses a significant public health problem in developing countries like India.1 Hence, screening for early detection of CKD is paramount. Traditional techniques, like serum parameters, ultrasonography (USG), and other imaging methods, have been employed to identify and assess renal diseases. Renal sonographic features, such as increased parenchyma echogenicity and reduced renal size and thickness of parenchyma, can be easily assessed. Echogenicity of renal parenchyma is a commonly used marker for nephropathy. However, this can be subjective, lacks quantitative values, and often fails to detect early renal abnormality. Thus, conventional renal ultrasound is usually equivocal in evaluating the progression of CKD.2
The estimated glomerular filtration rate (eGFR) derived from serum creatinine readings is now used to categorize CKD into five severity-based stages.3 The kidney’s histology impacts its mechanical characteristics, precisely the degree of fibrosis in renal parenchyma. As a result, renal biopsy continues to be the best method for histologically evaluating fibrosis.4 This invasive procedure could result in post-biopsy problems like bleeding. Therefore, there is an excellent inclination toward identifying safer techniques to assess nephropathy precisely.
Shear wave elastography (SWE) obtained by elastography (Acoustic radiation force impulse, ARFI technique) is a new ultrasound technique to assess tissue stiffness. A single real-time, short-duration, brief acoustic push pulse creates shear waves that propagate perpendicularly to the main sonography beam. When the waves hit the targeted tissue, the tissue is “pushed” in the direction of propagation, causing it to deform or displace temporarily. The shear wave propagation velocity is proportional to the tissue stiffness.5 The ultrasound scanner can monitor the displacement of tissue and measure time-to-peak displacement and recovery time, indicating tissue elasticity. The parameters are expressed as pressure units of kilopascals (kPa) or velocity (meter/seconds). Currently, elastography is employed in multiple organs such as the liver, breast, prostate, etc. One such approved and commonly used indication is the evaluation of hepatic fibrosis and staging of chronic liver disease (CLD).5–7
The renal resistive index (RI), derived from Doppler ultrasound of kidneys, acts as an independent prognostic marker in the progression of CKD.8 RI indirectly measures microcirculation resistance/impedance.9 In CKD, progressive glomerular atrophy, loss of renal mass, and fibrosis of tubular-interstitial tissues are responsible for the reduction in blood flow of renal parenchyma, thus decreasing the amplitude of the spectral wave profile and increasing the intrarenal resistance and thus resulting in a rise of RI values (>0.7).
It has been observed from a few previous studies of liver fibrosis 6,7 that hepatic stiffness increases with the progression of liver disease. Keeping this in mind, it can be postulated that similar changes should occur in renal tissues; thus, the advancement of CKD, measured by a decrease in eGFR, should lead to an increase in renal SWV. However, recently published data 10,11 showed that the renal SWV decreases with the progression of CKD and decreases in the eGFR, possibly related to the intrarenal hemodynamic changes.11–12
However, data about the relationship between renal SWV and Doppler parameters such as RI are scarce. Our study aimed to determine whether renal shear wave velocity (SWV) can distinguish between normal and diseased renal parenchymal tissue and assess the correlation between elastography and parameters such as eGFR, serum creatinine, and renal RI.
MATERIAL AND METHODS
The study was conducted following the Declaration of Helsinki and was approved by the institute’s local ethics committee (IHEC). Informed written consent was obtained from all patients before their enrolment in this study.
Study design: Cross-sectional descriptive observational study based on the hospital population.
Study setting: Done in a tertiary-level hospital with a total duration of 18 months, March 2021 to October 2022.
Subject selection: A written informed consent was signed by all participants.
Inclusion criteria:
Our study recruited participants in two groups from a hospital-based population: one group of patients with known CKD and the second group of healthy controls. Fifty-two diagnosed cases of CKD (based on the criteria from the National Kidney Disease Foundation guidelines) were recruited in the first group and referred from the internal medicine and nephrology department. Patients with structural renal diseases and renal calculi were excluded from our study. For the control non-CKD group, 54 subjects were recruited with no history of kidney disease, an eGFR of more than 60 mL/min, and no abnormal renal markers or regular healthy volunteers.
Exclusion criteria: Participants of both groups first underwent a conventional renal US examination to exclude those who have:
• More than 8 cm depth of renal cortex from the surface of the skin,
• Have thin renal cortical thickness (less than 10 mm),
• Patients with structural kidney disease such as calculi and/or infection, etc.
• Patients who refuse to participate in this research.
For both groups, data on age, sex, body mass index (BMI), absence or presence of diabetes mellitus and increased blood pressure, any other underlying causes of CKD (if present), and eGFR were recorded (using the CKD Epidemiology Collaboration formula).13
Elastography and color Doppler technique:
ARFI elastography was performed on the Acuson S2000 US system (Siemens AG), Virtual Touch quantification (VTTQ) software version 2.0, with a 4C1 1.6-MHz convex transducer.
A “region of interest” (ROI) cursor measuring 10 × 5 mm (dimensions predefined by the manufacturer) was placed in the renal cortex, along with continuous gray-scale mode monitoring. An attempt was made to align the central axis of the ROI box as parallel to the central axis of the pyramids as possible. After correctly positioning the ROI cursor, the “Update” button was pressed to start elastography, and the renal shear wave velocities were obtained in meters/second or m/s [Figure 1]. An average of three values was recorded at each pole of the kidney. Then, the RI was measured at the interlobar artery level by turning on the color Doppler box, and spectral tracings were recorded. A total of three values were taken, and their mean was calculated.
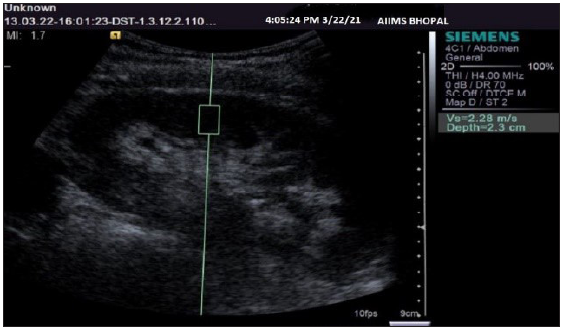
- Ultrasonography gray-scale sagittal image of a kidney showing the method of region of interest cursor placement and obtaining shear wave velocity values.
Statistical analysis
Collected data were submitted into Excel sheets (Microsoft Excel 2010) and transferred into Epi-info software after cleaning and rechecking (Epi Info version 7.2). Continuous data were expressed as the mean with standard deviation. The mean SWV and renal RI in cases and control groups were analyzed with the help of one-way analysis of variance (ANOVA) and the Tukey post hoc test. Correlations among outcome measures were analyzed using Pearson’s correlation coefficient (p equal to or less than 0.05). Receiver operating characteristic (ROC) curves were used to assess the diagnostic performance of SWE imaging in distinguishing at least grade 3 and above CKD kidneys from early CKD (grades 1 & 2) and healthy kidneys. Statistical tests were performed on collected data, and levels of significance were declared at p £ 0.05
RESULTS
Out of the total 52 cases in the CKD group, 25 (48%) were male patients and 27 (52%) were female patients, with their ages ranging from 19 to 68 years; the mean age was 48.2 years.
Out of a total of 54 participants in the control group, 28 (51.8%) were male and 26 (48.2%) were female. The mean age was 49.3 years.
The mean SWV among cases was 2.19 ± 0.30 m/s, and the mean SWV among controls was 2.51 ± 0.31 (p-value < 0.001). The mean RI among cases was 0.75 ± 0.05, and the mean RI among controls was 0.60 ± 0.05 (p-value < 0.001). Thus, mean SWV and mean RI were significantly elevated in CKD patients compared to the non-CKD control group [ Table 1].
| Cases | Controls | P value | |
|---|---|---|---|
| Shear wave velocity | 2.19 ± 0.30 | 2.51 ± 0.31 | <0.001 |
| Resistive index | 0.75 ± 0.05 | 0.60 ± 0.05 | <0.001 |
We also found the mean SWV among the different stages of CKD, which were 2.51 ± 0.26 m/s for stage 2, 2.34 ± 0.25 m/s for stage 3A, 2.24 ± 0.28 m/s for stage 3B, and 1.98 ± 0.21 m/s for stage 4 of CKD. This reflects the progressive decline in SWV values as the CKD stage advances [Table 2].
| No. | Mean | SD* | ||
|---|---|---|---|---|
| Mean SWV# | Stage 2 | 6 | 2.51 | 0.262 |
| Stage 3A | 10 | 2.34 | 0.256 | |
| Stage 3B | 17 | 2.24 | 0.283 | |
| Stage 4 | 19 | 1.98 | 0.216 | |
| Resistive index | Stage 2 | 6 | 0.71 | .022 |
| Stage 3A | 10 | 0.710 | .034 | |
| Stage 3B | 17 | 0.742 | .044 | |
| Stage 4 | 19 | 0.809 | .046 | |
#Shear wave velocity; *Standard deviation
CKD: Chronic kidney disease; eGFR: estimated glomerular filtration rate
The mean SWV among the non-CKD groups was 2.51 ± 0.31 ms, and the mean SWV values of early stage (stages 1 & 2) CKD were 2.51 ± 0.26 m/s, thus resulting in the considerable overlap between the non-CKD group and early stage CKD.
Mean RI among the CKD groups were 0.71 ± 0.02 for stage 2, 0.71 ± 0.03 for stage 3A, 0.74 ± 0.04 for stage 3B, and 0.80 ± 0.04 for stage 4 of CKD. This reflects the positive correlation between RI and the stage of CKD [Table 2].
For a cutoff value of 2.49 m/s or less, renal SWV showed a sensitivity of 84.62%, specificity of 87.04%, positive predictive value of 86.27% %, and negative predictive value of 85.45 % for predicting an eGFR of less than 60 mL/min/1.73m 2, i.e., at least grade 3 of CKD. (Area under ROC curve, 0.79; P = 0.001) [Figure 2].
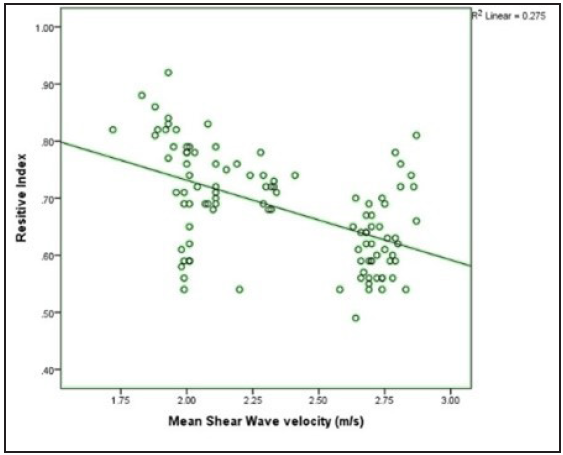
- Scatter plot showing the correlation of shear wave velocity with renal resistive index.
A correlation of SWV with the serum creatinine levels, eGFR and renal RI was performed. It was found that SWV shows a positive correlation with eGFR value (r value-0.554 and p-value < 0.001) and a negative correlation with renal RIresistive index (r value-0.524 and p-value < 0.001) [Figure 3] and with serum creatinine (r value-0.554 and p-value <0.001).
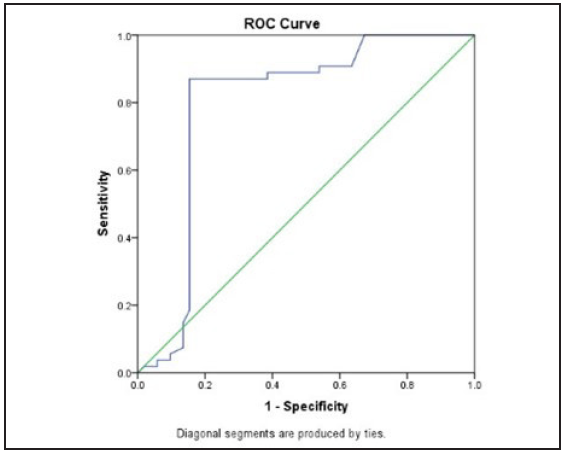
- The receiver operating characteristic Receiver operating characteristic (ROC) curve of shear wave velocity in differentiating cases and controls.
DISCUSSION
The renal assessment for staging and diagnosis of CKD using conventional Ultrasound is highly subjective, qualitative, and operator-dependent. There have been some attempts at characterizing renal echogenicity, parenchymal thickness, and renal length as markers of chronic disease.14
Elastography has emerged as a quantitative, noninvasive tool that has been commonly used and also standardized in some of the guidelines for the evaluation of hepatic fibrosis.15
In ARFI (VTTQ technique, Siemens) elastography for CLDs, SWV showed a good positive correlation with the stage of liver fibrosis.16 Kircheis et al. observed that hepatic tissue stiffness values increased significantly as fibrosis evolved.17 Mean SWV was 1.09 ± 0.13 m/s for patients with no significant fibrosis, 1.44 ± 0.26 m/s for patients with significant hepatic fibrosis, and 2.55 ± 0.77 m/s for patients with end-stage liver cirrhosis, respectively.17
The administration of Doppler, more importantly, renal RI, for the assessment of CKD is an independent predictor of prognosis.8 RI is an indirect measure of microcirculation impedance.9 The normal value in healthy persons is »0.60. An RI value of 0.70 is usually considered the normal upper limit.
In CKD, progressive glomerular atrophy, renal mass loss, and tubular-interstitial fibrosis are responsible for the reduction in renal blood flow, thus decreasing the amplitude of the spectral wave profile and resulting in an increase of RI values > 0.75–0.80 owing to high arterial stiffness, atherosclerotic eutrophic remodeling of small renal vessels, and microcirculation rarefaction.18
Our study showed a linear relationship of RI with stages of CKD. Mean RI showed a statistically significant difference between CKD and non-CKD groups. An inverse linear correlation was seen between SWV and RI.
In contrast to findings for liver parenchymal disease, SWV in patients with chronic renal disease was significantly lower than that in healthy controls in our study. The reason for such a difference remains to be determined. Some scholars speculated that it is because the kidney is an organ with rich perfusion, receiving 20% of cardiac output despite only constituting <1% of body mass.19 Therefore, renal blood perfusion may affect distension and stiffness of the kidney. Under normal conditions, to provide the large quantity of oxygen necessary to support massive reabsorption levels, the renal tubules are surrounded by a dense vascular plexus in both the cortex and medulla.19 As CKD advances, glomerular sclerosis, atrophy of tubules, and peritubular fibrosis gradually worsen. Subsequently, there is a decrease in blood flow in the peritubular vascular plexus. By looking at the extensive damage in microcirculation in advanced CKD, renal blood flow may significantly influence SWV values, which could be even more than interstitial fibrosis.
Asano et al. reported that the degree of interstitial fibrosis in the kidneys of CKD is not as marked as that in chronic liver disease. They suspected that interstitial fibrosis is not the main affecting factor of ARFI elastography in the kidney tissue elasticity.11 In the kidney, point SWE has been researched mainly using the ARFI (VTQ technique), which showed that kidney SWV values decreased with the progression of CKD.20 Our study also substantiated similar findings. In addition, our study also includes the assessment of renal hemodynamic status via the renal RI parameter, as many of the renal pathologies predominantly cause initial hemodynamical alteration earlier in the course of the disease than pathological fibrosis. In our study, in addition to the correlation of SWV with renal biochemical profile, we attempted to correlate the renal RI parameter, a marker of microvascular impedance with SWV, and the renal biochemical marker.
Our study showed a good correlation between renal RI and SWV. Compared to the study by Guo et al.,10 we tried to find a renal SWV cutoff value to differentiate between patients with and without moderate and severe alteration of kidney function. In our study, it was observed that a cutoff renal SWV value of 2.49 m/s could be used to discriminate at least grade 3 and above CKD kidneys from early CKD and controls with sensitivity, specificity, positive predictive value, negative predictive value, and accuracy of 84.62%, 87.04%, 86.27%, 85.45%, and 85.85%, respectively. This finding implies that this method can be used as an excellent discriminating parameter in unequivocal states of CKD, such as diabetic nephropathy, where the conventional US parameter, such as renal length, is generally not reduced until the late course of the disease.
Our study also found that renal SWV values decreased with increased serum creatinine and a decline in the eGFR. A statistically significant difference was observed between renal SWV values in patients with an eGFR of 90 mL/min/1.73 m2 compared to patients with stage 4 or 5 CKD (eGFR, <30 mL/min/1.73 m2). In our study, the obtained mean SWVs among the CKD groups were 2.51 ± 0.26 m/s for stage 2, 2.34 ± 0.25 m/s for stage 3A, 2.24 ± 0.28 m/s for stage 3B, and 1.98 ± 0.21 m/s for stage 4 of CKD. These findings reflect the potential use of the ARFI technique for staging CKD, as there is a linear correlation between SWV and clinical and biochemical staging of CKD.
CONCLUSION
In conclusion, renal SWV values in our study were significantly different in CKD cases compared to healthy controls. Among the CKD patients, SWV values showed a progressive decline with deterioration of eGFR vis-a-vis an increase in the severity of CKD, an increase in renal RI, and an increment in serum creatinine values.
As per our data, for diagnosis of at least grade 3 CKD on renal ultrasound elastography, a cutoff value of SWV of 2.49 m/s or less can be used while maintaining good sensitivity and specificity.
Hence, renal SWV values, along with renal RI, can help predict the progression of CKD. Thus, it can be a potential adjunct imaging method for assessing patients with CKD, especially in the case of diabetic nephropathy, where conventional US findings can be equivocal.
Ethical approval
Institutional Review Board approval was acquired before commencement of the study.
Declaration of patient consent
Patient’s consent is not required as patient’s identity is not disclosed or compromised.
Financial support and sponsorship
Nil.
Conflicts of interest
There are no conflicts of interest
Use of artificial intelligence (AI)-assisted technology for manuscript preparation
The authors confirm that there was no use of artificial intelligence (AI)-assisted technology for assisting in the writing or editing of the manuscript and no images were manipulated using AI.
References
- The definition, classification, and prognosis of chronic kidney disease: a KDIGO Controversies Conference report. Kidney Int. 2011;80:17-28.
- [CrossRef] [PubMed] [Google Scholar]
- Prevalence of chronic kidney disease and decreased kidney function in the adult US population: Third National Health and Nutrition Examination Survey. Am J Kidney Dis Off J Natl Kidney Found. 2003;41:1-12.
- [Google Scholar]
- Chronic kidney disease: global dimension and perspectives. Lancet Lond Engl. 2013;382:260-72.
- [Google Scholar]
- Renal ultrasound elastography. Diagn Interv Imaging. 2013;94:545-50.
- [CrossRef] [PubMed] [Google Scholar]
- Quantifying hepatic shear modulus in vivo using acoustic radiation force. Ultrasound Med Biol. 2008;34:546-58.
- [CrossRef] [PubMed] [PubMed Central] [Google Scholar]
- Intra- and interoperator reproducibility of acoustic radiation force impulse (ARFI) elastography--preliminary results. Ultrasound Med Biol. 2012;38:1103-8.
- [CrossRef] [PubMed] [Google Scholar]
- Performance of acoustic radiation force impulse imaging for the staging of liver fibrosis: a pooled meta-analysis. J Viral Hepat. 2012;19:e212-219.
- [CrossRef] [PubMed] [Google Scholar]
- Renal arterial resistive index is associated with severe histological changes and poor renal outcomes during chronic kidney disease. BMC Nephrol. 2012;13:139.
- [CrossRef] [PubMed] [PubMed Central] [Google Scholar]
- Current insights into the significance of the renal resistive index in kidney and cardiovascular disease. Diagn Basel Switz. 2023;13:1687.
- [Google Scholar]
- Acoustic radiation force impulse imaging for non-invasive non-invasive evaluation of renal parenchyma elasticity: preliminary findings. PLOS ONE. 2013;8:e68925.
- [CrossRef] [PubMed] [PubMed Central] [Google Scholar]
- Acoustic radiation force impulse elastography of the kidneys: is shear wave velocity affected by tissue fibrosis or renal blood flow? J Ultrasound Med Off J Am Inst Ultrasound Med. 2014;33:793-801.
- [Google Scholar]
- A new equation to estimate glomerular filtration rate. Ann Intern Med. 2009;150:604-12.
- [CrossRef] [PubMed] [PubMed Central] [Google Scholar]
- National kidney foundation practice guidelines for chronic kidney disease: evaluation, classification, and stratification. Ann Intern Med. 2003;139:137-47.
- [CrossRef] [PubMed] [Google Scholar]
- Chronic renal failure.statpearls. Treasure Island (FL): StatPearls Publishing; 2023. [cited 2023 Jul 29]. Available from: http://www.ncbi.nlm.nih.gov/books/NBK535404/
- Shear wave elastography for breast masses is highly reproducible. Eur Radiol. 2012;22:1023-32.
- [CrossRef] [PubMed] [PubMed Central] [Google Scholar]
- Ultrasound shear wave elastography and liver fibrosis: A Prospective Multicenter Study. World J Hepatol. 2017;9:38-47.
- [CrossRef] [PubMed] [PubMed Central] [Google Scholar]
- Evaluation of acoustic radiation force impulse imaging for determination of liver stiffness using transient elastography as a reference. World J Gastroenterol WJG. 2012;18:1077-84.
- [CrossRef] [PubMed] [PubMed Central] [Google Scholar]
- Vascular smooth muscle cells and arterial stiffening: relevance in development, aging, and disease. Physiol Rev. 2017;97:1555-617.
- [CrossRef] [PubMed] [Google Scholar]
- Applications of acoustic radiation force impulse quantification in chronic kidney disease: a review. Ultrasonography. 2016;35:302-8.
- [CrossRef] [PubMed] [PubMed Central] [Google Scholar]
- Novel uses of ultrasound to assess kidney mechanical properties. Kidney360. 2021;2:1531-9.
- [CrossRef] [PubMed] [PubMed Central] [Google Scholar]