Translate this page into:
Optimization of CT radiation dose: Insight into DLP and CTDI
* Corresponding author: Dr. Mohd Arfat, Assistant Professor, Paramedical College, Faculty of Medicine, Aligarh Muslim University, Aligarh-India. marfat.pmc@amu.ac.in, arfat.radiology@gmail.com
-
Received: ,
Accepted: ,
How to cite this article: Mohd A. Optimization of CT radiation dose: Insight into DLP and CTDI. Future Health. 2024;2:148-52. doi: 10.25259/FH_45_2024
Abstract
The computed tomography dose index (CTDI) and dose–length product (DLP) are critical for monitoring and optimizing radiation doses. CTDI estimates the dose per slice, whereas DLP calculates the total dose across the scanned area. These measures enhance consistency in dose assessments, make comparisons easier, and assist in keeping doses within regulatory limits. This article explores the functions of CTDI and DLP in CT imaging, focusing on their importance in dosage optimization and patient safety. Understanding and monitoring this information allows healthcare professionals to strike a compromise between high-quality imaging and reduced radiation exposure, assuring patient care and regulatory compliance.
Keywords
CTDI
DLP
Radiation dose optimization
Patient safety
Ionizing radiation
Image quality effective dose

INTRODUCTION
Computed tomography (CT) has revolutionized medical diagnostics, providing high-resolution images critical for accurate diagnosis and treatment planning. However, CT is associated with rather high-radiation exposures, which raises worries about the potential of carcinogenesis.1,2 Consequently, optimizing radiation dose in CT scans is essential to maximize diagnostic benefits while minimizing health risks.
According to the International Atomic Energy Agency, for diagnostic medical exposure, the exposure of patients must be kept to the minimum necessary level to achieve the required diagnostic or interventional objectives.3 During a CT examination for a specific clinical objective, a quality image should be recorded without unnecessary doses to the patients. All guidelines, therefore, include reference doses that are described as diagnostic reference levels (DRL).4
Key metrics in radiation dose management include the computed tomography dose index (CTDI) and the dose–length product (DLP). CTDI measures the radiation dose from a single slice of the scan, reflecting the scanner’s output under standard conditions, while DLP accounts for the total radiation dose considering the length of the scanned area. Both metrics are integral to assessing and managing the radiation dose delivered during CT procedures. They provide reference values for exposure but have no direct relationship to patient dosing. DRLs are essential in regulating patient exposure and providing treatment precision during CT scans.
Fundamentals of CT radiation dosimetry
In CT, radiation dosimetry refers to measuring, calculating, and evaluating the radiation dosage administered to patients during a CT scan. These principles must be understood to ensure diagnostic image quality while minimizing patient exposure and optimizing radiation use. In CT imaging, doses to patients are estimated from image data by using CTDI and DLP values. Furthermore, from the recorded data, effective doses are estimated by using the product of the region-specific normalizing constant, which is the effective dose–length product (EDLP), and the DLP from the International Commission on Radiological Protection publication 103.5
Computed tomography dose index (CTDI)
The CTDI is a standardized measure of a CT scanner’s radiation dosage output, indicating the dose delivered per slice. It is used to determine how much radiation a patient absorbs during a CT scan.
CTDI100 (measured over a 100-mm-long ionization chamber) and CTDIw (weighted average of dosage over a single slice) were previously used; however, for helical scanners in use today, the parameter CTDIvol is the more widely used index.6
CTDI100: This measurement indicates the dosage from a single axial CT slice and is made using an ionization chamber that is 100 mm long and housed inside a phantom.
CTDIW (Weighted CTDI): The CTDIw is the weighted average of the CTDI100 measurements at the center and the peripheral locations of the phantom. This value represents the average absorbed dose over the x and y dimensions of the phantom, which is an estimate of the average radiation dosage to a cross-section of a patient’s body.7
CTDI vol (Volume CTDI): CTDI vol is derived directly from the volumetric multidetector row system. It is estimated by dividing by the pitch factor (P) in order to obtain the total CTDI volume, expressed as:8
For a given scanner and set of acquisition parameters, the CTDI volume is fixed and independent of patient size and scan length.9
CTDI is critical for ensuring consistent dose measurements across multiple CT scanners and procedures. It enables dose-level comparisons and aids in the maintenance of doses within regulatory limits.
The CTDI is obtained by using a 100-mm long pencil-shaped ionization chamber in one of two phantom sizes (16 or 32 cm in diameter). Most manufacturers compute the CTDI using a 16-cm phantom for head examinations and a 32-cm phantom for body examinations (including the neck).10
Modern CT scanners frequently include software tools that employ multi-detector data to generate CTDI and the DLP, resulting in a thorough estimate of total radiation dosage for entire examinations. Automated dose monitoring systems that are integrated with the scanners continuously track and record radiation doses, providing real-time feedback as well as historical records. Regular quality assurance programs, which include routine tests with phantom, are essential for verifying the accuracy and consistency of every CT scanner [Figure 1].11
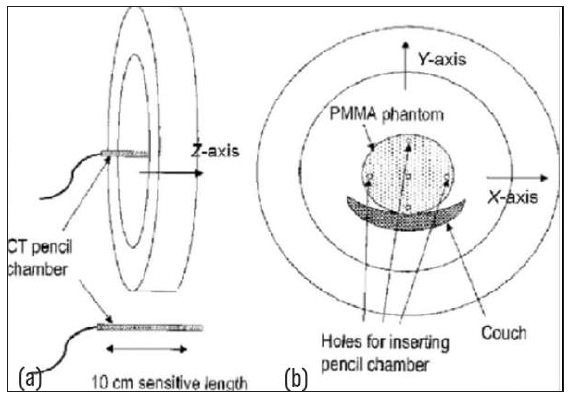
- Diagrammatic representation of Computed Tomography Dose index phantom, PMMA Polymethyl Methacrylate, CT Computed Tomography. (a) CT pencil chamber positioned along the Z-axis within a cylindrical setup, (b) PMMA (Polymethyl Methacrylate) phantom placed on a couch, with its position marked along the X, Y, and Z axes.
DLP (Dose–length product)
The DLP is the total radiation dose multiplied by the length of the body part being scanned.
The DLP is a dose quantity that describes the dose given to the patient for a complete examination; therefore, the potential biological effect can be estimated. Hence, it is used to estimate the effectiveness of a body region. This parameter is captured and displayed in the image data. The mGy cm is the international standard SI unit.12
The DLP does not consider the patient’s size and is not a measure of absorbed dose. If the anteroposterior and lateral dimensions of the patient are known, the size-specific dose estimate can be used to calculate the absorbed dosage.13
To calculate the DLP, first measure the CTDI with a pencil ionization chamber set in a cylindrical phantom. DLP can be calculated using the formula DLP = CTDIvol × Scan length, which takes into account the scan length obtained from the CT scanner’s software or pictures. Unit consistency, with CTDIvol in milligrays (mGy) and scan duration in centimeters (cm), is critical for accurate results.
The CT scanner generates a radiation dosage sheet, which displays critical information regarding an examination. It serves as a road map for the examination, outlining which CT examinations were performed and what parameters were used to conduct them. The CTDIvol, a critical component of the radiation dose sheet, is a widely used radiation dose index that appears on most CT scanners [Figures 2 and 3].14
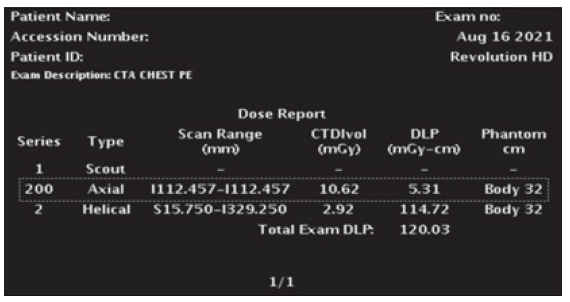
- GE Healthcare (Series 200) dose sheet for bolus tracking in a chest CT angiography pulmonary embolism study, DLP: Dose length product, CTD: Computed tomography dose, CTA: Computed Tomography Angiography.
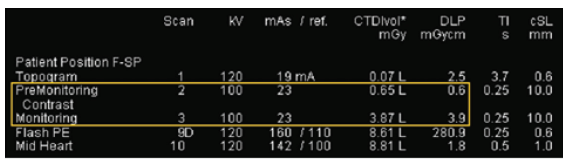
- The image displays a CT scan report detailing parameters such as kV, mAs, CTDI vol, and DLP for various phases, including Topogram, PreMonitoring, and Contrast Monitoring. TI: Timing interval, cSL: Collimated slices, F-SP: Field of scan protocol, kV: Kilovoltage, CTDI: Computed tomography dose index, DLP: Dose length product.
DLP and CTDI together to estimate patient dose
The relationship between CTDI and DLP is crucial for understanding and controlling radiation exposures. DLP quantifies the total dose throughout the scan’s full length, whereas CTDI determines the dose per unit volume. The formula for this relation
In clinical practice, these metrics are combined to improve CT protocols and lower patient exposure. The amount of radiation used (i.e., DLP) is directly proportional to the patient’s effective dose.15 Furthermore, DLP can be translated to an effective dose using conversion factors specific to distinct body locations, allowing for a more complete assessment of the radiation’s possible biological consequences.
Here, k is the conversion factor that depends on the body region (e.g., head, chest, abdomen). This relationship allows for the assessment of potential radiation risks and aids in optimizing CT protocols to minimize patient exposure.
A key aspect is optimizing the CTDI and DLP to ensure diagnostic efficacy while minimizing radiation exposure. Patient-specific factors play a crucial role in dose optimization. For instance, younger patients are more sensitive to radiation, necessitating lower doses. Similarly, a patient’s size and body mass index (BMI) affect the required radiation dose; larger patients may require higher doses to achieve adequate image quality. The clinical indication for the scan also influences dose settings, as certain conditions may demand higher-resolution images, which require higher doses. Balancing these factors involves a careful assessment to adjust CTDI and DLP appropriately, ensuring that the images are diagnostically useful without exposing patients to unnecessary radiation. This balance is critical to safeguarding patient health and achieving optimal diagnostic outcomes.
Importance in clinical practice
Dose optimization: By understanding and optimizing CTDI and DLP, radiologists can ensure that patients receive the minimum radiation dose necessary for an accurate diagnosis, adhering to the ALARA (As Low As Reasonably Achievable) principle. Adjusting parameters such as tube current, voltage, and scan time helps reduce CTDIvol and, consequently, DLP. This careful optimization maintains high image quality while significantly enhancing patient safety. By minimizing the risks associated with radiation exposure. Radiologists can provide effective diagnostic information with the least possible harm to the patient. Continuous monitoring and protocol adjustments further ensure adherence to ALARA, reinforcing a commitment to patient-centered care.
Patient safety: Monitoring DLP and utilizing it to estimate effective doses aids in determining the risk-benefit ratio of CT scans, particularly for patients who require multiple scans.
Regulatory compliance: Adhering to DRLs established by regulatory organizations guarantees that radiation exposures remain within acceptable ranges. CTDI and DLP measures are crucial for compliance.
Practical guidelines to optimize CT doses in their daily practice
Due to a growing demand for CT examinations, patients are being exposed more frequently to ionizing radiation.16 Radiologists and technologists can implement several strategies to optimize CT doses, ensuring diagnostic quality while minimizing patient exposure. Here are some useful recommendations and guidelines:
1. Adjust milliampere (mA) settings
Reduce mA: One straightforward way to reduce CTDIvol is to lower the milliampere (mA) setting. For example, a 25% reduction in mA will reduce the CTDIvol and patient dose by 25%.
Automatic exposure control (AEC): Utilize AEC systems that adjust the mA in real-time based on patient size and density, optimizing the dose for each scan.
2. Modify kilovolt peak (kVp)
Lower kVp for suitable exams: Lowering the kVp can significantly reduce the radiation dose. This is particularly useful in pediatric imaging or in scans where contrast is used, as lower kVp can enhance contrast resolution.
Individualize kVp: Adjust kVp based on patient size and the clinical indication of the scan.
3. Optimize scan length
Limit scan range: Ensure the scan length is limited to the area of clinical interest. Avoid scanning regions that are not necessary for diagnosis.
Careful planning: Pre-plan the scan protocol to include only the essential areas to be imaged.
4. Personalize scanning protocols
Patient-specific adjustments: Adjust scanning protocols based on patient age, size, BMI, and clinical indication to ensure the dose is appropriate for the individual.
Pediatric protocols: Use specific pediatric protocols for children, which account for their increased sensitivity to radiation.
5. Implement dose monitoring and feedback systems
Track dose metrics: Regularly monitor and record dose metrics such as CTDIvol and DLP for each scan. Use these data to review and refine scanning protocols.
Feedback loops: Establish feedback loops where dose data are reviewed by radiologists and technologists to identify opportunities for dose reduction.
6. Education and training
Ongoing training: Ensure all radiology staff are trained in dose optimization techniques and are aware of the latest guidelines and technological advancements.
Dose awareness: Foster a culture of dose awareness where minimizing radiation exposure is a key priority.
Looking ahead, future directives in CT dose optimization are poised to leverage advancements in research and technology. Ongoing research is investigating new approaches to reducing radiation exposure while retaining diagnostic efficacy. Emerging technologies, such as artificial intelligence (AI), show promise in predicting DLP values from large databases of patient characteristics and scan information. AI techniques can be used at every stage of a CT examination to improve picture quality, increase workflow efficiency for the operator and radiologist, and reduce image noise, allowing the radiation dose delivered to the patient to be reduced during data collecting.17 Furthermore, advances in iterative reconstruction techniques and dosage monitoring systems improve real-time dose management capabilities. These improvements seek not just to improve patient safety by reducing excessive radiation exposure but also to modify imaging techniques for more personalized and efficient healthcare delivery.
CONCLUSION
The integration of CTDI and DLP in CT imaging is fundamental to achieving the critical balance between diagnostic efficacy and radiation safety. These metrics enable healthcare providers to monitor and optimize radiation doses, ensuring patients receive the necessary diagnostic information while minimizing exposure to ionizing radiation. By understanding and controlling CTDI and DLP, radiologists can tailor imaging protocols to achieve high-quality images essential for accurate diagnosis and treatment planning. This optimization ensures that images are clear and detailed enough without unnecessary radiation exposure, thereby enhancing patient safety and diagnostic precision. Moreover, standardizing CT protocols based on CTDI and DLP values is crucial for consistent and safe imaging practices.
Ethical approval
Institutional Review Board approval is not required.
Declaration of patient consent
Patient’s consent not required as there are no patients in this study.
Financial support and sponsorship
Nil.
Conflicts of interest
There are no conflicts of interest.
Use of artificial intelligence (AI)-assisted technology for manuscript preparation
The authors confirm that there was no use of AI-assisted technology for assisting in the writing of the manuscript and no images were manipulated using AI.
REFERENCES
- Health Risks from Exposure to Low Levels of Ionizing Radiation: BEIR VII Phase 2. Washington: National Academies Press; 2006.
- Cancer risks from diagnostic radiology. Br J Radiol. 2008;81:362-78.
- [CrossRef] [PubMed] [Google Scholar]
- Radiation Protection and Safety in Medical Uses of Ionizing Radiation. Vienna, Austria: International Atomic Energy Agency; 2018.
- Brussels: European Commission; European Guidelines on Quality Criteria for Computed Tomography. Report EUR 16262 EN.
- Digital Imaging and Communications In Medicine, Supplement 127: CT Radiation Dose Reporting (Dose SR), DICOM Standards Committee, Rosslyn, VA (2007)
- Bashir U, Campos A, McKay L, CT dose index. Reference article, Radiopaedia.
- Radiation dose in computed tomography of the heart. Circulation. 2003;107:917-22.
- [CrossRef] [PubMed] [Google Scholar]
- Comparison of measured values of CTDI and DPL with standard reference values of different CT Scanners for dose management. Int J Sci Res Sci Technol 2017:185-90.
- [CrossRef] [Google Scholar]
- Determination of the weighted CT dose index in modern multi-detector CT scanners. Phys Med Biol. 2007;52:6485-95.
- [CrossRef] [PubMed] [Google Scholar]
- Volume CT dose index and dose-length product displayed during CT: what good are they? Radiology. 2011;258:236-42.
- [CrossRef] [PubMed] [Google Scholar]
- A survey of paediatric CT radiation doses in two selected hospitals in Kampala, Uganda: a radiation safety concern. Int J Cancer Ther Oncol. 2015;3:3327.
- [CrossRef] [Google Scholar]
- X-ray beam filtration, dosimetry phantom size and CT patient dose conversion factors. Phys Med Biol. 2010;55:551-61.
- [CrossRef] [PubMed] [Google Scholar]
- Morgan M, Chieng R, Yap J. Dose length product. Reference article, Radiopaedia.
- Demystifying the CT radiation dose sheet. RadioGraphics,. 2022;42:1239-50.
- [CrossRef] [PubMed] [Google Scholar]
- Converting dose-length product to effective dose at CT. Radiology. 2008;248:995-1003.
- [CrossRef] [PubMed] [PubMed Central] [Google Scholar]
- Computed tomography — an increasing source of radiation exposure. N Engl J Med. 2007;357:2277-84.
- [CrossRef] [PubMed] [Google Scholar]
- Use of artificial intelligence in computed tomography dose optimisation. Ann ICRP. 2020;49(1_suppl):113-125.
- [CrossRef] [PubMed] [Google Scholar]