Translate this page into:
Imaging spectrum of acute invasive sinonasal mucormycosis in patients with COVID-19: A pictorial review
*Corresponding author: Radha Sarawagi, Department of Radiodiagnosis and Imaging, All India Institute of Medical Sciences (AIIMS), Bhopal, India radha.radiodiagnosis@aiimsbhopal.edu.in
-
Received: ,
Accepted: ,
How to cite this article: Anitha Chettiar B, Malik R, Sarawagi R, Patel A, Sharma J, Kumar A, et al. Imaging spectrum of acute invasive sinonasal mucormycosis in patients with COVID-19: A pictorial review. Future Health. 2024;2:35–43. doi: 10.25259/FH_6_2024
Abstract
The advent of severe acute respiratory syndrome coronavirus (SARS-CoV) during the latter half of 2019 brought a new face to the global medical scenario. With a rising trend in COVID infectivity and the concomitant use of steroids in its management, it emerged as a risk factor for the development of acute invasive fungal infections of the paranasal sinus in these patients. In India, the medical scenario turned towards a rise in the number of fulminant mucormycosis infections in post-COVID patients. This infection caused rapid invasion via the perineural pathway and extensive angioinvasion, which led to an increase in morbidity and mortality. Early diagnosis of this infection became crucial to ward off any preventable complications. This pictorial review focuses on the varied early and late imaging appearances on Computed Tomography (CT) and Magnetic Resonance Imaging (MRI), keeping the focus on MR imaging to make the diagnosis, to know the extent of the infective process, diagnose early complications and for surgical planning.
Keywords
Mucormycosis
COVID -19
Imaging
fungal sinusitis

INTRODUCTION
Towards the latter half of 2019 and 2020, the global medical scenario, especially in India, was dominated by the severe acute respiratory syndrome coronavirus (SARS-CoV). Predominantly, it manifests as an upper respiratory tract infection, progressing to systemic inflammation and coagulopathy due to its prothrombotic nature.1 Concurrent administration of steroids for treatment led to an immunocompromised state and uncontrolled blood sugar levels. Spores of fungi, which are seen in vegetation and soil, find an opportunity to infect such individuals and thrive, leading to the development of fungal sinusitis, which leads to an acute invasive fulminant infection in these patients.1
Broadly, fungal sinusitis is classified as invasive and non-invasive. When the paranasal sinuses show the presence of fungal hyphae in the local tissue, such as within mucosa, blood vessels, adjacent soft tissue, neural tissue or bone, it is referred to as invasive fungal sinusitis. These are further subclassified into acute invasive fungal sinusitis, chronic invasive fungal sinusitis, and chronic granulomatous invasive fungal sinusitis. Noninvasive fungal sinusitis is labeled when there is the absence of hyphae in the local tissues.2
Acute invasive fungal sinusitis is a rapidly progressing infection, especially in patients with specific comorbidities. The at-risk group includes patients with diabetes mellitus and diabetic ketoacidosis where the causative agents are Absidia, Rhizomucor, Rhizopus, and Mucor, which belong to the genera ‘Mucorales’ and are referred to by the terms ‘Mucormycosis’ or ‘Mucor Infection.’ Another at-risk group of patients is those with immunocompromise and severe neutropenia. It includes patients with hematologic malignancy who are undergoing systemic steroid/ chemotherapy and bone marrow transplantation, patients with acquired immune deficiency syndrome, systemic immunosuppressive therapies, etc. The primary organism responsible for most infections in this subset is usually the Aspergillus species.2
PATHOLOGY
Infection begins with the colonization of the fungus in the turbinates or the sinus mucosa, followed by inflammation and rapid invasion of the soft tissues of the face and orbit.2 Fungal hyphae invade along nerves and vessel walls, leading to the perineural and extensive angiogenic spread.3 The clinical progression of acute invasive fungal sinusitis includes three stages: Stage 1: Infection of sinus and nasal mucosa, Stage 2: Orbital soft tissue and optic nerve involvement, Stage 3: Intracranial spread via any of the following routes: a) ophthalmic artery, b) superior orbital fissure - leads to cavernous sinus thrombosis and internal carotid artery thrombotic occlusion, and c) Cribriform plate - spread to the frontal lobes via perineural and perivascular channels through the cribriform plate.4
CLINICAL PRESENTATION
The most commonly reported symptoms were headache, epistaxis, nasal discharge, facial swelling, reduced vision, and fever. Advanced cases were also reported with stroke or cranial nerve involvement.5
IMAGING
Imaging is essential in determining the extent of the disease, which is vital in early treatment planning and timely intervention.6
Nasal mucosa and paranasal sinus disease
Computed Tomography (CT) scan in inflammatory sinonasal fungal disease can demonstrate varying degrees of mucosal thickening, hyperdense contents, fluid collections, and opacification of the involved paranasal sinuses. Air-fluid levels are also seen in a few patients.7 Local invasion into adjacent tissues appears as areas of fat stranding (premaxillary/retrolental), obliteration of regular fat planes, and soft tissue thickening. There is a rapid invasion of the fungal elements into the local arterial supply, leading to thrombosis, following which there is necrosis of the soft tissue supplied by those vessels. Hence, varying enhancement patterns from mild to heterogeneous enhancement and non-enhancing areas are seen on contrast-enhanced CT scans. The non-enhancing mucosa corresponds to necrotic/ devitalized tissue [Figure 1].8 Bony erosion/ rarefaction may not be very evident or is subtle because the spread to tissues beyond the sinus occurs mainly via the perivascular or perineural pathways [Figure 2].6
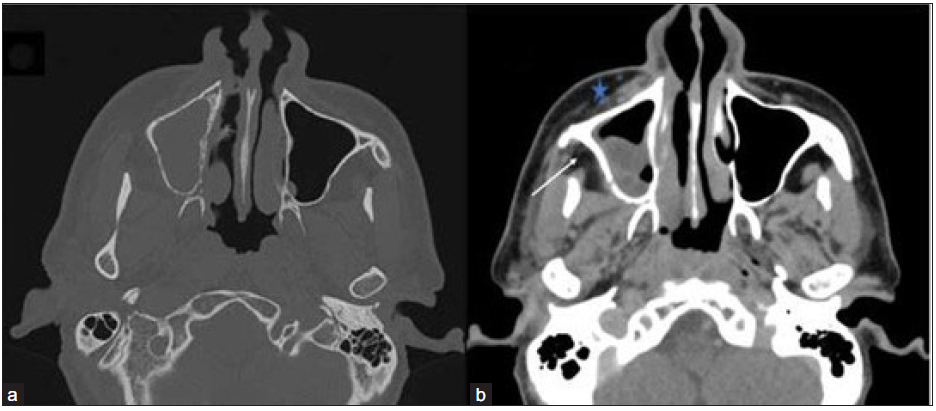
- Axial non-contrast CT (NCCT) in the bone window (a) and contrast-enhanced CT (CECT) in soft tissue window (b) of the paranasal sinus of a 48-year-old male, post COVID with paresthesia in the right side of face depict hypodense mucosal thickening showing heterogenous enhancement in the right maxillary sinus. Bony rarefaction is noted in the medial wall of the right maxillary sinus, and minimal soft tissue thickening and stranding are observed in pre-maxillary (star) and retro-antral fat (arrow).
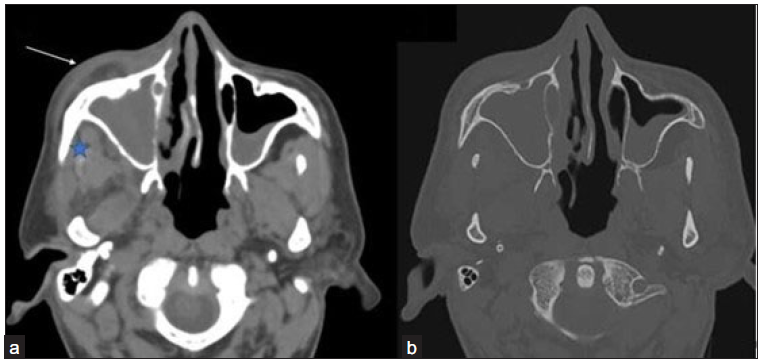
- (a-b) Axial non contrast computed tomography (NCCT) images in soft tissue window and bone window of the paranasal sinus of a 42-year-old male, post COVID with swelling in the right side of the face reveals opacification of right maxillary sinus with soft tissue thickening in pre-maxillary (arrow) and retro-antral fat (star) No evidence of any bony changes noted in the walls of the right maxillary sinus.
Magnetic Resonance Imaging (MRI) better evaluates the intracranial extension and adjacent soft tissue involvement, presence of skull base invasion, perineural spread, and vascular occlusion.9 The normal mucosa appears smooth on MRI, with a homogenous hyperintense signal on T2-weight Imaging (T2WI). A mucosa infected with fungi can appear iso to hypointense on T1-weighted images (T1WI) and shows variable signal on T2-weighted images (T2WI). The presence of calcium deposits, air, and ferromagnetic elements (such as magnesium, manganese, and iron) as dense concretions impart hypointense signal intensity on T2WI [Figure 3]. The presence of soft tissue invasion into the deep spaces of the neck and face is characterized by fat stranding, signal changes in the form of hyperintensities on fat-saturated T2WI, and necrosis in the masticator space, infratemporal fossa, the pterygopalatine fossa, and the pterygomaxillary fissure.2
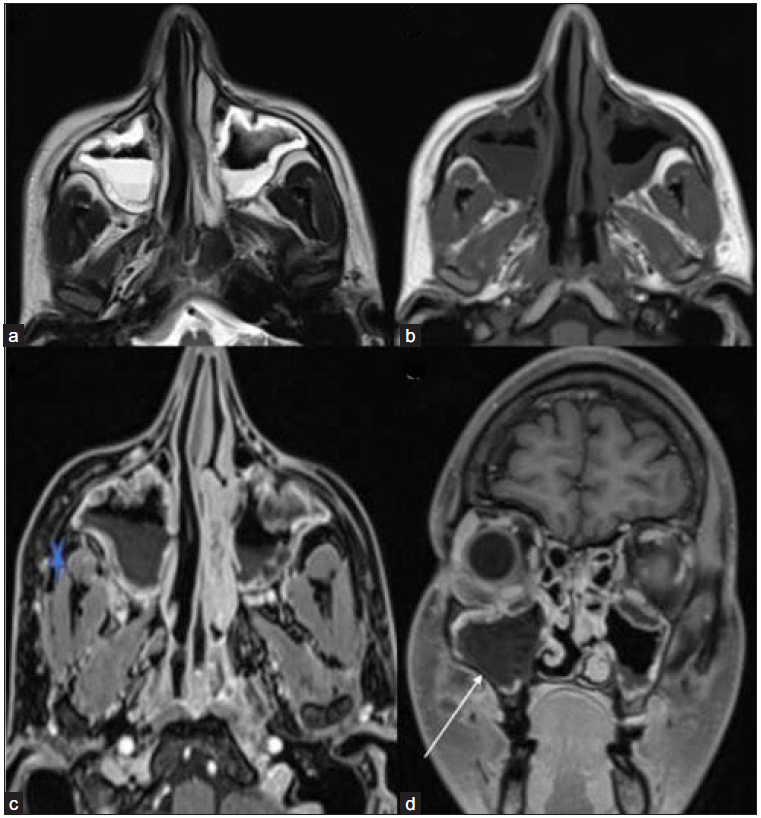
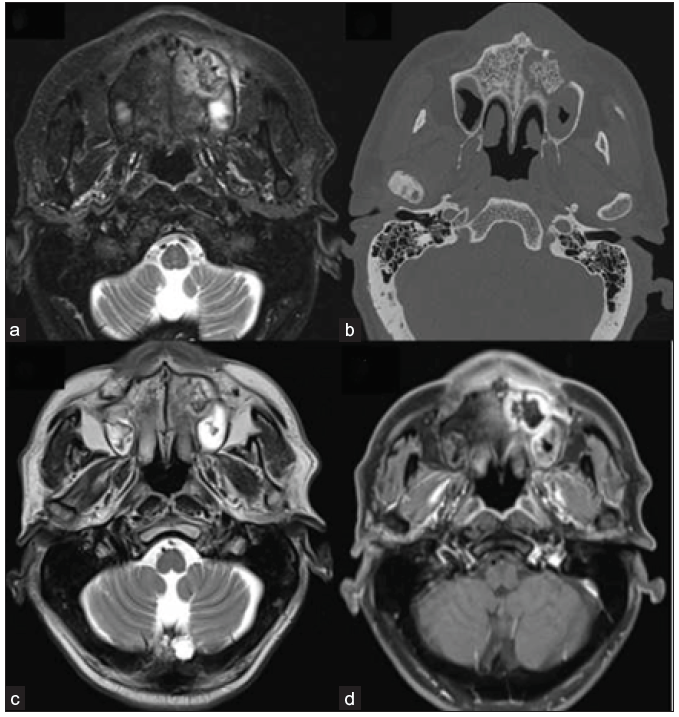
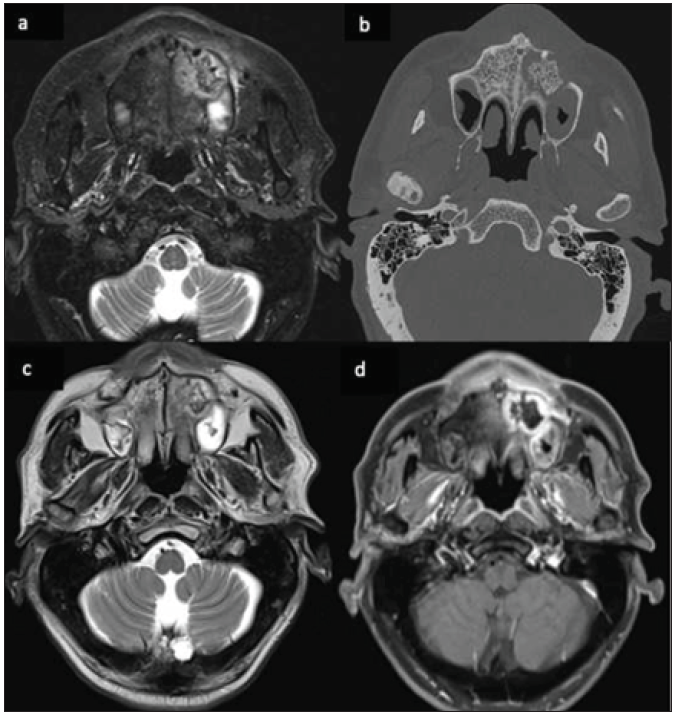
- T2-weighted axial (a) image reveals mucosal thickening in bilateral maxillary sinuses with an air-fluid level. The mucosa appears homogeneously hyperintense on the left and shows mild heterogeneity on the right side. (b) On the T1-weighted axial image, the mucosa appears hypointense. (c) Post-contrast fat-saturated T1-weighted axial (star) and coronal (d) images depict soft tissue thickening and stranding in the right retro-maxillary area with non-enhancing mucosa in the right maxillary sinus (white arrow).
Vascular thrombosis in the affected tissue causes rapid necrosis, resulting in non-enhancement areas on post-contrast sequences. Mycotic invasion and infarction of tissues lead to cytotoxic edema, which can lead to restricted diffusion on Diffusion Weighted Imaging (DWI)/Apparent Diffusion Coefficient (ADC) [Figure 4].3, 5 Non-enhancing mucosa along the nasal turbinates, also known as “black turbinate sign”, helps in early diagnosis and is considered a highly suggestive finding of mucormycosis. However, there are pitfalls in the interpretation of this sign. Areas of non-enhancement may be seen in the nasal turbinates as a common finding in MRI in normal healthy people. These non-enhancing areas are predominantly central with preserved thin peripheral enhancement. It is located more commonly at the midportion or posterior part of the turbinate and shows delicate septa or dot-like appearance in the early phase of post-contrast sequences. It shows an increase in enhancement with time. In patients of acute invasive fungal sinusitis, persistent confluent non-enhancing areas with variable signal intensity on T2WI are suggestive of a Black turbinate sign [Figure 5].10 Involvement of the bone is identified by the development of bone marrow edema in the form of short tau inversion recovery (STIR) hyperintense signals which complicate into osteonecrosis/ osteomyelitis [Figure 6].11
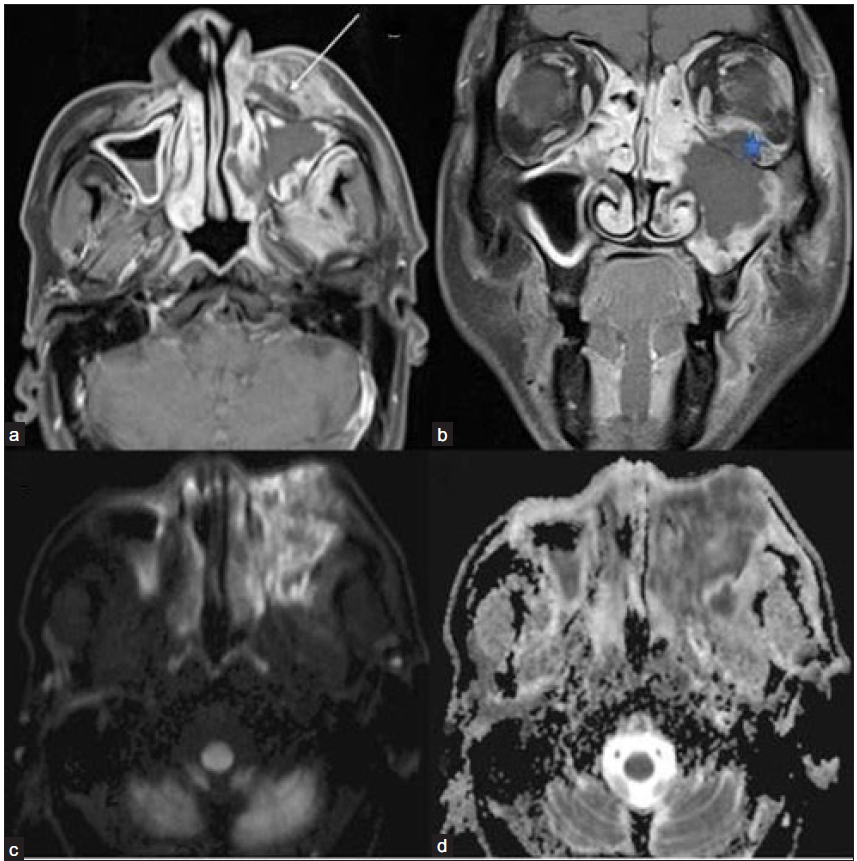
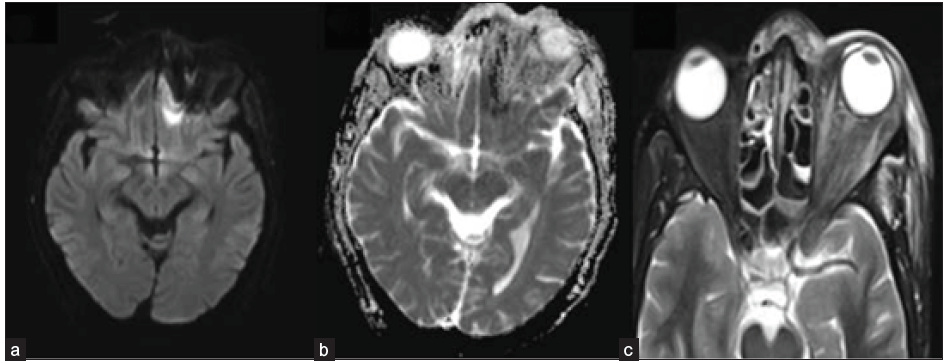
- Post-COVID 60-year-old male with pain swelling on the left side of his face and reduced vision in the left eye. (a) Post-contrast fat-saturated T1-weighted axial (arrow) and coronal (b) images show non-enhancing necrotic areas in the left pre-maxillary region(arrow), left maxillary sinus mucosa, and in the intra-orbital soft tissue (star). Diffusion-weighted image/ DWI (c) reveals extensive areas of hyperintense signal in the left maxillary sinus mucosa and adjacent soft tissue with a corresponding drop on ADC image (d), suggesting necrosis or non-viable tissue. DWI = diffusion weighted imaging; ADC = apparent diffusion coefficient
- 42-year-old male, post-COVID with facial pain. Axial T2-weighted (a), T1-weighted (b), and STIR (c) sequence of the paranasal sinuses depict T2 hyperintense, T1 hypointense mucosal thickening in the right maxillary sinus. T2 hypointense and T1 hyperintense areas are also present along the inner aspect of the mucosal thickening. The right retro-antral fat pad and the medial and lateral pterygoid muscles show STIR hyperintensity. (d) Post-contrast saturated T1-weighted coronal (star) and axial (e) images show heterogeneous mucosal enhancement in the right maxillary sinus. A confluent non-enhancing necrotic area is noted along the right middle and inferior turbinates, giving a ‘black turbinate sign’ (star). The right retro-antral region also has a patchy non-enhancing area (arrow). STIR = short tau inversion recovery
- A 62-year-old male, post-COVID, with swelling in the upper alveolar region and left side of the face. Axial STIR image (a), Non contrast CT bone window image (b), and T2-weighted image (c) reveals ill-defined heterogeneous signal intensity in the left alveolar arch of the maxilla and adjacent part of the hard palate with central hypo-intensity corresponding to bone fragment. On post-contrast fat-saturated T1-weighted image (d), there is non-enhancement of this central bone fragment, suggesting osteonecrosis. STIR = short tau inversion recovery
Orbital spread of disease
MRI is superior to unenhanced CT to determine the regional extent and severity of orbital infection. Invasion of the orbits is evident with hyperintensity of the intraconal fat and extraocular muscles on T2WI/ STIR images. There is associated thickening and abnormal enhancement of the involved muscles [Figure 7]. With progressive involvement of the orbital soft tissue, there is an increase in the intra-compartment pressure. This leads to outward bulging of the walls of the orbits, eventually resulting in proptosis. Development of non-enhancing necrotic areas and peripherally enhancing collection/abscess occurs once there is involvement of the orbital vessels leading to thrombosis. Later stage complications include ischemia of the optic nerve, which reveals restriction on DWI/ADC [Figure 8].3, 5
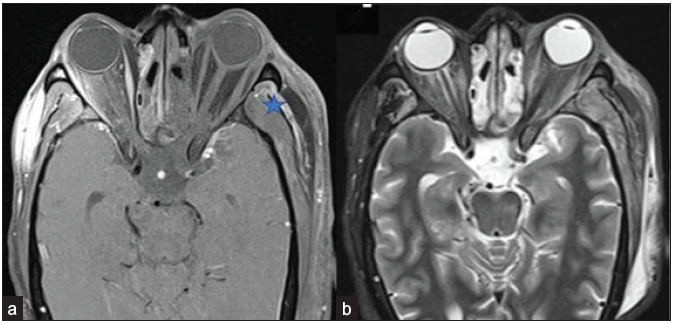
- A 56-year-old male with black discoloration on the left side of his face and vision loss, loss of eye movements, and ptosis on day 20 post-COVID. Axial post-contrast fat-saturated T1-weighted (a) and STIR (b) images reveal non-enhancing left extra-ocular muscles and the intra & and conal fat, suggesting extensive devitalization and necrosis; right extraocular muscles show normal enhancement pattern. Also, note the tenting of the posterior wall of the left globe, suggesting raised intra-orbital pressure. Heterogeneously enhancing mucosal thickening in the bilateral ethmoidal air cells is also seen. Edema and a small area of non-enhancement are present in the left temporalis muscle fibers and adjacent scalp (star). The note is made of inhomogeneous fat suppression along the lateral aspect of the right orbit (a). STIR = short tau inversion recovery
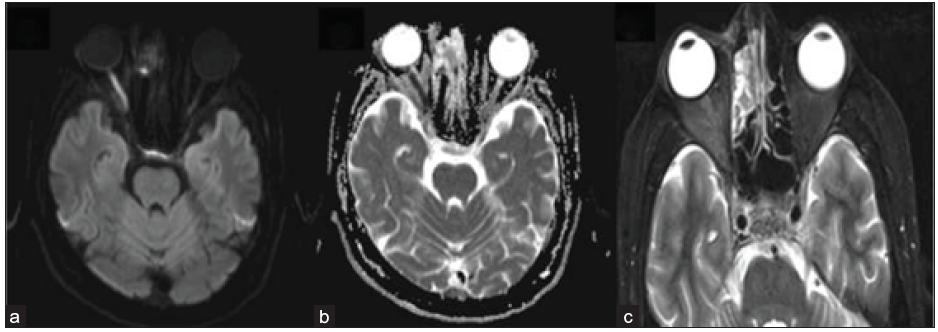
- 42-year-old male, day 10 post-COVID, with reduced vision in right eye. Axial DWI (a) reveals a hyperintense signal in the right optic nerve with a corresponding signal drop on ADC (b), suggesting diffusion restriction and ischemia. Axial STIR image (c) depicts right peri-optic fat stranding and heterogeneous mucosal hyperintensity in the right ethmoidal air cells. STIR = short tau inversion recovery; DWI = diffusion weighted imaging; ADC = apparent diffusion coefficient
Intracranial spread of disease
The most common finding of intracranial invasion on MRI is leptomeningeal enhancement. Perineural spread along the cribriform plates into the anterior cranial fossa leads to epidural and subdural empyema.12 Further extension leads to the involvement of the basifrontal region [Figure 9]. Involvement of the anterior temporal lobes can also occur via extension from the orbital apices. Cerebritis leading to cerebral abscess formation is seen in such cases. Early cerebritis is seen as poorly defined cortical or subcortical T2/Fluid attenuation inversion recovery (FLAIR) hyperintensity with surrounding diffuse vasogenic edema. There may be minimal or heterogeneous enhancement with patchy restricted diffusion. Late cerebritis reveals progressive peripheral enhancement and restricted diffusion, which further organizes to form a cerebral abscess [Figure 10].13
- A 49-year-old male with blackish discoloration on the left side of his face. Axial DWI (a) and ADC image (b) depict restricted diffusion in the left basi-frontal region (arrow). Axial STIR image (c) shows heterogeneous mucosal thickening in the ethmoidal air cells and inflammatory changes in the left pre-septal and intra-orbital soft tissue. DWI = Diffusion weighted imaging; ADC = Apparent diffusion coefficient, STIR = short tau inversion recovery
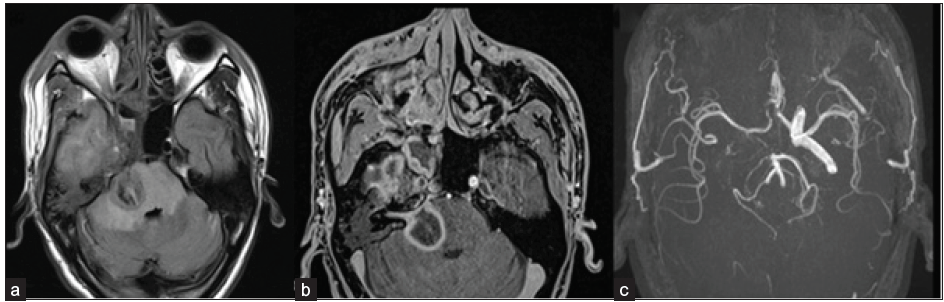
- A 45-year-old male, post-COVID, with a history of altered sensorium. Axial FLAIR (a) and axial post-contrast fat-saturated T1-weighted (b) images depict a large area of FLAIR hyperintensity representing edema with peripheral rim enhancement within it in the right side of the pons, consistent with late cerebritis/ abscess stage. The right 7th/8th nerve complex is enhanced and thickened in the internal auditory canal. FLAIR hyperintensity is also seen in the right temporal lobe with heterogeneous enhancement. On TOF MR angiography images (c), the flow-related signal is absent in the right internal carotid artery (ICA). FLAIR = Fluid attenuation inversion recovery; TOF = Time of flight
Vascular invasion causes several dreaded complications, such as arterial thrombosis, cavernous sinus thrombosis, mycotic aneurysms, and intracerebral hemorrhage. Spread into the cavernous sinus is identified by the increased bulk, bulging walls, absent flow voids on T1/T2-weighted images, and hypointense filling defects, in contrast, angiogram.5 The development of arterial/venous thrombosis is the cause of cerebral infarcts. DWI is the best sequence in the diagnosis of acute ischemic infarcts. T2WI will demonstrate loss of flow voids of the involved thrombosed vessel with loss of flow-related signal in Time of flight (TOF) MR angiography images. Contrast perfusion images are diagnostic [Figure 11].9
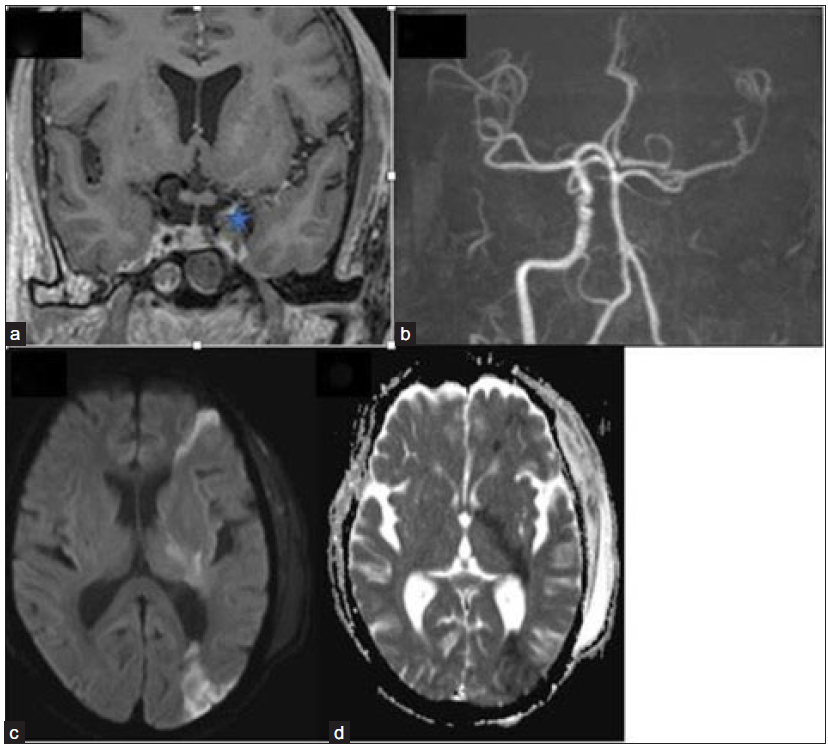
- Coronal post-contrast fat, saturated T1-weighted image (a) depicts a bulky left cavernous sinus with a hypointense filling defect (star). 3-dimensional TOF MR angiography image (b) reveals the absence of flow-related signal in the left ICA with attenuation of its terminal branches. Axial DWI (c) and ADC image (d) show restricted diffusion in the left fronto-parietal region and internal capsule, suggesting acute watershed infarcts. TOF = Time of flight; ICA = Internal carotid artery; DWI = diffusion weighted imaging; ADC = apparent diffusion coefficient
Invasion into the middle cranial fossa by involving the Meckel’s cave, trigeminal nerve, and an extension to the posterior cranial fossa with brainstem involvement may also be found during imaging. On MRI, direct findings suggest perineural spread nerve enlargement, irregularity, and excessive enhancement [Figure 12].8 On CT, loss of normal fat pad adjacent to a widened foramen indicates perineural spread.6
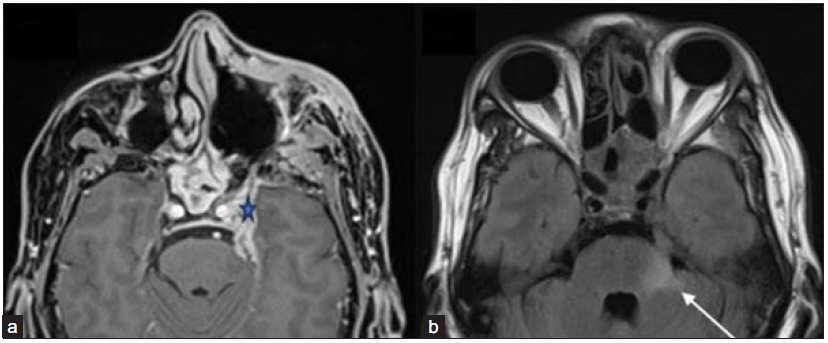
- A 51-year-old male post-endoscopic debridement for sino-nasal mucormycosis with persistent headache with perineural involvement along the left trigeminal nerve. (a) Axial post-gadolinium fat-saturated T1-weighted image (star) and FLAIR image (b) reveal thickened and enhancing left trigeminal nerve (star) with FLAIR hyperintense signal in the pons and left middle cerebellar peduncle (arrow). Pachymeningeal enhancement is also noted along the left middle cranial fossa. Also, note the mucosal thickening and enhancement in the posterior ethmoidal and sphenoid sinuses. FLAIR = Fluid attenuation inversion recovery
CONCLUSION
With several risk factors at play, the rapid spread and invasion of the fugal inflammatory process made acute invasive fungal rhinosinusitis/mucormycosis a dreadful complication in the COVID era. Being a fulminant and rapidly spreading infection, a very high index of suspicion needs to be kept in place. Knowledge of the full spectrum of imaging findings is essential for radiologists to avoid misdiagnosis and assist with timely diagnosis for early and effective treatment. MRI plays a vital role in detecting even subtle and early inflammatory changes, with the limited role of CT. Aiding the surgeon in planning early debridement surgeries can help improve morbidity and mortality outcomes.
Ethical approval
Institutional Review Board approval is not required.
Declaration of patient consent
Patient consent is not required as the patient’s identity is not disclosed or compromised.
Financial support and sponsorship
Nil.
Conflicts of interest
There are no conflicts of interest.
Use of artificial intelligence (AI)-assisted technology for manuscript preparation
The authors confirm that there was no use of artificial intelligence (AI)-assisted technology for assisting in the writing or editing of the manuscript, and no images were manipulated using AI.
References
- Zygomycosis: an emerging fungal infection with new options for management. Curr Infect Dis Rep. 2007;9:435-40.
- [CrossRef] [PubMed] [Google Scholar]
- Invasive and non-invasive fungal rhinosinusitis-a review and update of the evidence. Medicina (Kaunas). 2019;55:319.
- [CrossRef] [PubMed] [PubMed Central] [Google Scholar]
- Rhino-orbito-cerebral mucormycosis: Magnetic resonance imaging. Indian J Otol. 2015;21:215-8.
- [Google Scholar]
- Cerebro-rhino orbital mucormycosis: An update. J Infect Public Health. 2012;5:116-26.
- [CrossRef] [PubMed] [Google Scholar]
- Imaging features of rhinocerebral mucormycosis: A study of 43 patients. Egypt J Radiol Nucl Med. 2018;49:447-52.
- [Google Scholar]
- Acute Invasive Fungal Rhinosinusitis: A comprehensive update of CT findings and design of an effective diagnostic imaging model. AJNR Am J Neuroradiol. 2015;36:1529-35.
- [CrossRef] [PubMed] [PubMed Central] [Google Scholar]
- Fungal rhinosinusitis and imaging modalities. Saudi J Ophthalmol. 2012;26:419-26.
- [CrossRef] [PubMed] [PubMed Central] [Google Scholar]
- Perineural spread of rhinocerebral mucormycosis. AJNR Am J Neuroradiol. 1996;17:114-6.
- [PubMed] [PubMed Central] [Google Scholar]
- Rapidly progressive rhino-orbito-cerebral mucormycosis complicated with unilateral internal carotid artery occlusion: A Case Report. Neurointervention. 2012;7:45-9.
- [CrossRef] [PubMed] [PubMed Central] [Google Scholar]
- The black turbinate sign, a potential diagnostic pitfall: Evaluation of the normal enhancement patterns of the nasal turbinates. AJNR Am J Neuroradiol. 2019;40:855-61.
- [CrossRef] [PubMed] [PubMed Central] [Google Scholar]
- Mucormycosis originated total maxillary and cranial base osteonecrosis: A possible misdiagnosis to malignancy. BMC Oral Health. 2021;21:65.
- [CrossRef] [PubMed] [Google Scholar]
- Rhinocerebral mucormycosis: a ten-year single centre case series. Cureus. 2020;12:e11776.
- [CrossRef] [PubMed] [PubMed Central] [Google Scholar]
- Imaging features of rhinocerebral mucormycosis: From onset to vascular complications. Acta Radiol. 2022;63:232-44.
- [CrossRef] [PubMed] [Google Scholar]